

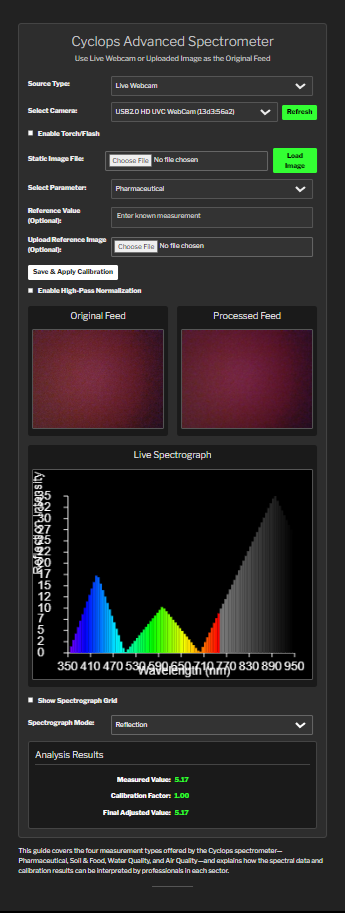
This guide covers the four measurement types offered by the Cyclops spectrometer—Pharmaceutical, Soil & Food, Water Quality, and Air Quality—and explains how the spectral data and calibration results can be interpreted by professionals in each sector.
Cyclops Spectrometer User Guide
Table of Contents
- Introduction
- Pharmaceutical Measurements
- 2.1 Overview
- 2.2 Measurement Process
- 2.3 Data Interpretation & Decision Criteria
- Soil & Food Analysis
- 3.1 Overview
- 3.2 Measurement Process
- 3.3 Data Interpretation & Best Practices
- Water Quality Measurement
- 4.1 Overview
- 4.2 Measurement Process
- 4.3 Data Interpretation & Regulatory Guidelines
- Air Quality Measurement
- 5.1 Overview
- 5.2 Measurement Process
- 5.3 Data Interpretation & Health Implications
- Calibration and Quality Control
- Troubleshooting and Support
- Appendices
- 8.1 Glossary
- 8.2 References
1. Introduction
The Cyclops Spectrometer is an online spectrometry solution designed for rapid, on-site analysis. It can be accessed a a browser on a smartphone, tablet or laptop over the Internet from anywhere. Cyclops utilizes a built-in camera of a device (or a user-provided image) to capture light intensity profiles and applies spectral analysis across a wavelength range of 350 nm to 950 nm. This guide explains how professionals from various sectors can use and interpret the measurement results.
2. Pharmaceutical Measurements
2.1 Overview
Pharmaceutical applications focus on verifying the authenticity of drugs and detecting counterfeit products. The Cyclops spectrometer examines the spectral signature of a medicine sample and compares the measured values to known standards.
2.2 Measurement Process
- Sample Preparation: Place a tablet, capsule, or liquid sample against a uniform white background.
- Data Acquisition: Use the live camera feed to capture the spectral profile. The device extracts the light intensity in the critical band (typically in the red region, 600–700 nm, for many drugs).
- Calibration: If available, input a known reference value or upload a reference image of an authentic drug for calibration.
- Analysis: The device computes a measured value based on the average intensity in the chosen spectral range and applies any calibration factor.
2.3 Data Interpretation & Decision Criteria
- Authentic Product: A measured value closely matching the calibrated reference indicates high probability of authenticity.
- Potential Counterfeit: Deviations beyond a specified threshold suggest the product may be counterfeit.
- Further Action: Confirmatory laboratory testing is recommended for borderline cases.
3. Soil & Food Analysis
3.1 Overview
In agriculture, precise soil and food quality measurements are essential. Cyclops can be used to assess soil fertility, detect nutrient deficiencies, and evaluate the freshness and ripeness of produce.
3.2 Measurement Process
- Soil Analysis: Capture an image of soil (ideally with a reference card). The spectral data (often in the green band, 450–650 nm) correlate to organic matter and moisture levels.
- Food Analysis: For fruits and vegetables, capture images under controlled lighting. The device analyzes color shifts (e.g., the green-to-yellow transition) to estimate ripeness and detect spoilage.
- Calibration: Use either a numeric reference (e.g., known pH or nutrient level) or a reference image (from a certified sample).
3.3 Data Interpretation & Best Practices
- Soil Health Score: Lower measured values may indicate low fertility or high contamination. Comparisons to standard soil tests can inform fertilization needs.
- Fruit Ripeness Score: A specific intensity range in the visible spectrum helps determine optimal harvest time. Produce that falls outside this range may be under-ripe or over-ripe.
- Food Freshness: Abnormal spectral signatures (such as unexpected browning) signal spoilage or degradation.
4. Water Quality Measurement
4.1 Overview
Water quality testing is critical for ensuring safe drinking water and environmental protection. The Cyclops spectrometer analyzes the water sample’s color and turbidity, which are indicative of chemical contaminants and organic material.
4.2 Measurement Process
- Sample Collection: Place a water sample in a clear container against a white background.
- Data Acquisition: The spectrometer captures the light transmission and absorption characteristics primarily in the blue-green range (350–500 nm) to determine clarity and potential contaminants.
- Calibration: Use a reference sample (either by numeric value or image) from a certified water quality test.
4.3 Data Interpretation & Regulatory Guidelines
- Safe Water: A measured value within the calibrated “safe” range indicates low contaminant levels.
- Moderate Contamination: Intermediate values suggest potential issues and recommend further lab analysis.
- Unsafe Levels: High deviations from the reference signal significant contamination, necessitating immediate corrective action.
5. Air Quality Measurement
5.1 Overview
Air quality monitoring is vital in urban planning and public health. The Cyclops spectrometer can be used to evaluate the clarity of the sky and the presence of pollutants by analyzing the light scattering characteristics.
5.2 Measurement Process
- Data Capture: Use the live feed to photograph a section of the sky or a white reference card placed outdoors.
- Spectral Focus: Measurements in the green-yellow spectrum (500–600 nm) are particularly informative about particulate matter and gaseous pollutants.
- Calibration: Input a known air quality index (AQI) value or upload a reference image from a certified monitoring station.
5.3 Data Interpretation & Health Implications
- Good Air Quality: A measured spectral intensity indicating low pollutant levels corresponds to a low AQI.
- Moderate Air Quality: Intermediate values may warrant caution, especially for sensitive populations.
- Poor Air Quality: High intensity in absorption or altered reflection patterns signal heavy pollution, prompting public warnings and remediation efforts.
6. Calibration and Quality Control
For all measurement types:
- Calibration Step: Use a known numeric reference or upload a certified reference image.
- Adjustment Factor: The plugin computes a calibration factor to align the measured value with the known standard.
- Quality Control: Regular calibration against laboratory-grade equipment is recommended to maintain measurement accuracy.
7. Troubleshooting and Support
- Camera and Image Sources:
- Ensure you use the device in a secure context (HTTPS or localhost).
- Verify that camera permissions are granted.
- Normalization and Calibration:
- If results appear inconsistent, check your lighting conditions and ensure proper calibration.
- Contact Support:
- For further assistance, please contact our technical support team.
8. Appendices
8.1 Glossary
- Calibration Factor: A multiplier applied to the measured spectral intensity to align with a reference standard.
- High-Pass Normalization: A process that removes low-frequency variations (e.g., uneven lighting) from the image to enhance detail.
- Spectral Signature: The unique pattern of light absorption or reflection across different wavelengths.
- AQI: Air Quality Index, a standardized indicator of air pollution levels.
8.2 References
- Industry guidelines for water and air quality.
- Standard protocols for pharmaceutical counterfeit detection.
- Agricultural best practices for soil and produce analysis.
- Technical documentation for smartphone-based spectrometry.
This guide is intended for professional users who require rapid, on-site analysis using the Cyclops spectrometer.