
Then, in two quick steps:
- log in
- upload your image
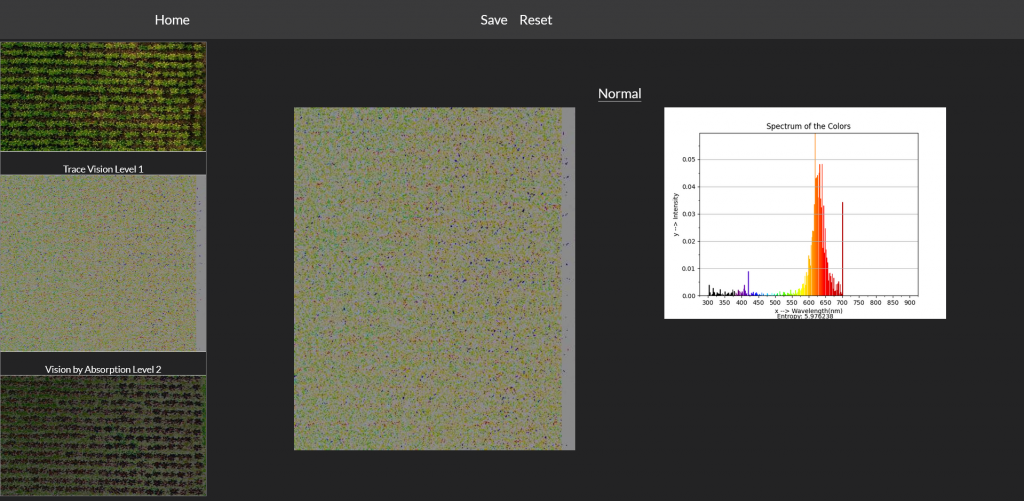
Example: AGRICULTURE – Crop Field
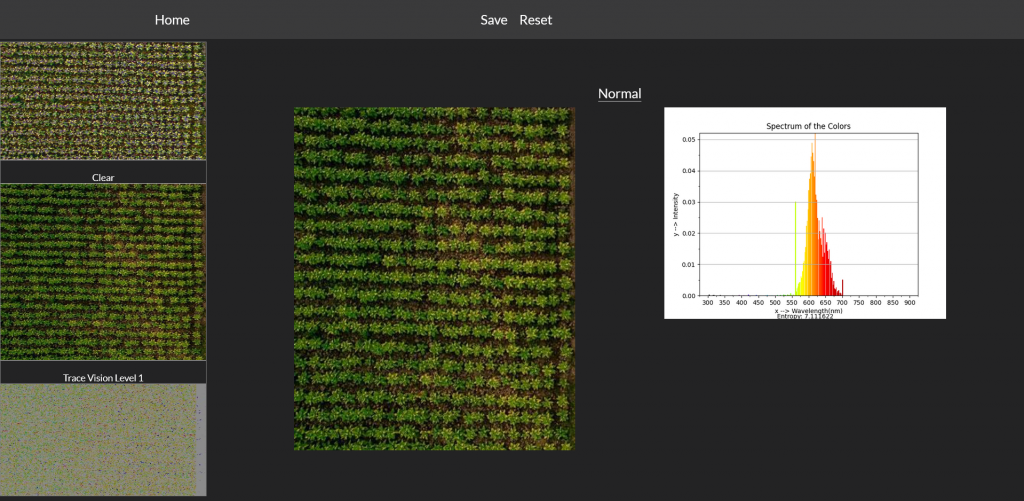
ORIGINAL UPLOADED: with spectrograph and entropy value
With Reflection Vision Level 1 scan (materials reflectance intensity mainly with reflected light waves, by spectroscopy and materials variability entropy):
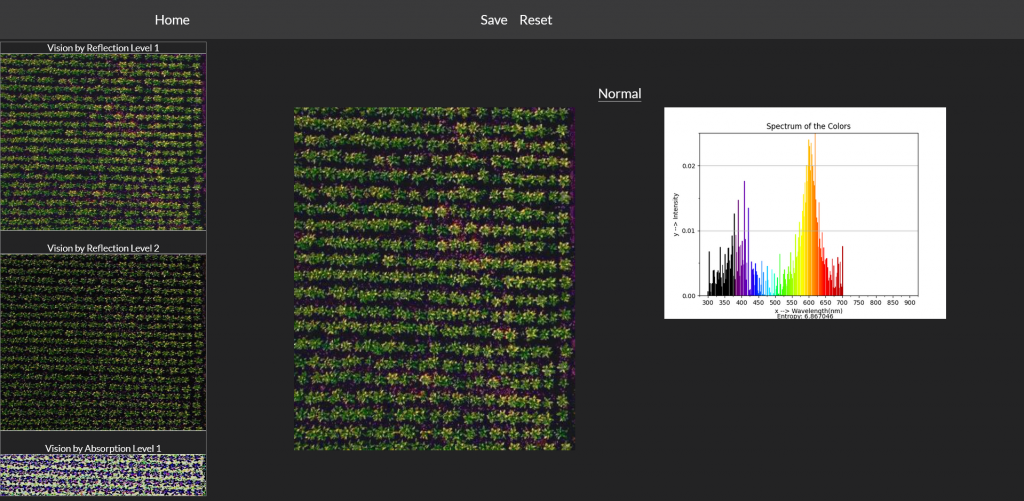
With Reflection Vision Level 2 scan (materials reflectance intensity mainly with reflected light waves, by spectroscopy and materials variability entropy):
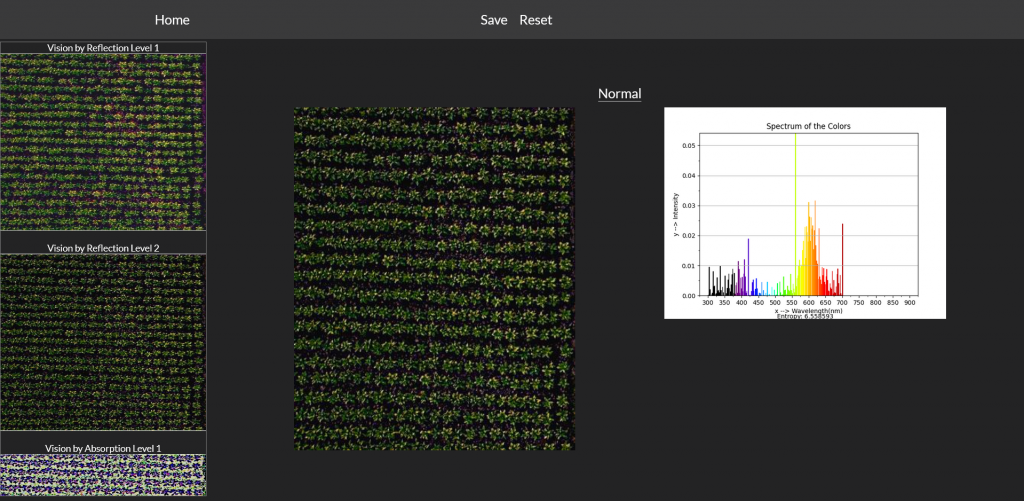
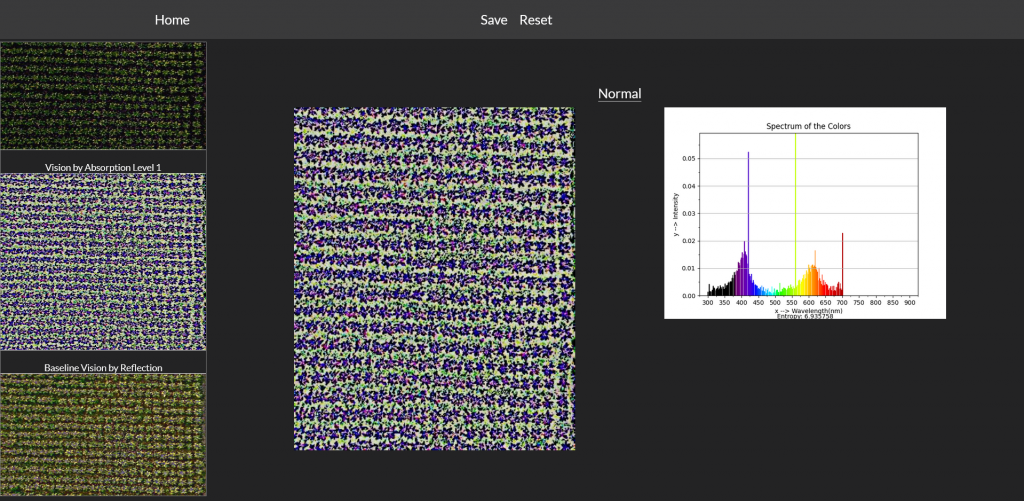
With Absorption Vision Level 1 scan (materials absorbance intensity mainly with absorbed light waves, by spectroscopy and materials variability entropy):
With Trace Vision Level 1 scan (materials trace (areas of similar material properties) intensity mainly with absorbed light waves, by spectroscopy and materials variability entropy):
Absorption Vision Level 2 and other methods are also available. .
In addition, you can:
- select the auto spectrograph to plot and view how materials in your image interact with light (reflection, absorption etc.). You will also see a value (entropy) telling you the variability of the materials or objects in your image.
- select ‘Save’ to save your image in your device or use your browser’s screenshot feature to capture a processed image and its spectrograph together.
- use the ‘screenshot in your device or browser to capture the image with the spectrograph or by itself.
NOTE: Files types Tiff, GeoTiff, Jpg, PNG and BMP can be processed. Maximum file size is 5Mb. On average, each result takes 30 seconds depending on your file size and Internet speed. The larger your file size, the more time it takes to deliver each result so be aware! Keep file sizes small but with optimum resolution. Ideally, your file size should be less than 1Mb.
What is a surface?
By our definition it is any material that prevents or reduces visibility beyond it. Smoke, haze, soil, leaf ‘skin’ and planetary dust are all examples of surfaces. Subsurface is what is visible beyond it.
What is a spectrograph?
The spectrograph plots the level of reflection, absorption or trace material at various wavelengths for the material within the image. It can be used in many ways to gain insight of the materials captured in the image.
What is ‘entropy value’?
The entropy value indicates the average variability of the materials encountered in the captured image. This helps to provide insight into the smoothness of the material encountered for example.